
Last Updated: November 13, 2026
Quick Summary
Evaluating revit drafting productivity means measuring what the drafter delivers, not the hours spent. Count completed sheets, resolved redlines, and error-free deliverables, and track rework rate and model health rather than keystrokes or mouse clicks.
- Track sheets completed per week by project type and complexity.
- Measure redlines resolved per review cycle, not per day.
- Reward speed alone and drafters skip model checks, causing later rework.
- Pull sheet counts and warning logs from Revit schedules and add-ins.
- Review metrics weekly rather than daily to avoid number-focused behavior.
Table of Contents
- The Revit Drafting Productivity Metrics That Show Real Output
- Revit Error and Rework Tracking: The Hidden Cost of Speed
- Revit Productivity Tools and Remote Drafter Performance Metrics
- Comparing Standard and High-Efficiency Drafting Metrics
- Frequently Asked Questions
The Revit Drafting Productivity Metrics That Show Real Output
Evaluating Revit drafting productivity metrics starts with one practical principle: measure what the drafter delivers, not the hours spent. Count completed sheets, resolved redlines, and error-free deliverables.
Revit drafting is the production of coordinated building models and construction documents inside Autodesk Revit. Productivity is how many usable, accurate deliverables a drafter completes in a set period, not mouse speed.
- Sheets completed per week, by project type and complexity
- Redlines resolved per review cycle, not per day
- Rework rate, meaning the share of work redone after review
- Model health, including warnings and unresolved clashes
- On-time delivery rate against agreed milestones
Tracking keystrokes or mouse clicks through add-ins looks scientific but says nothing about whether the drawing set is buildable. The Autodesk Revit documentation is clear that model-based workflows reward coordination, not raw speed. Measure what ships.
Revit Error and Rework Tracking: The Hidden Cost of Speed
Rework is a number many firms overlook, and it can quietly erode margin. A drafter producing twelve sheets a week sounds productive, until four come back with coordinate errors.
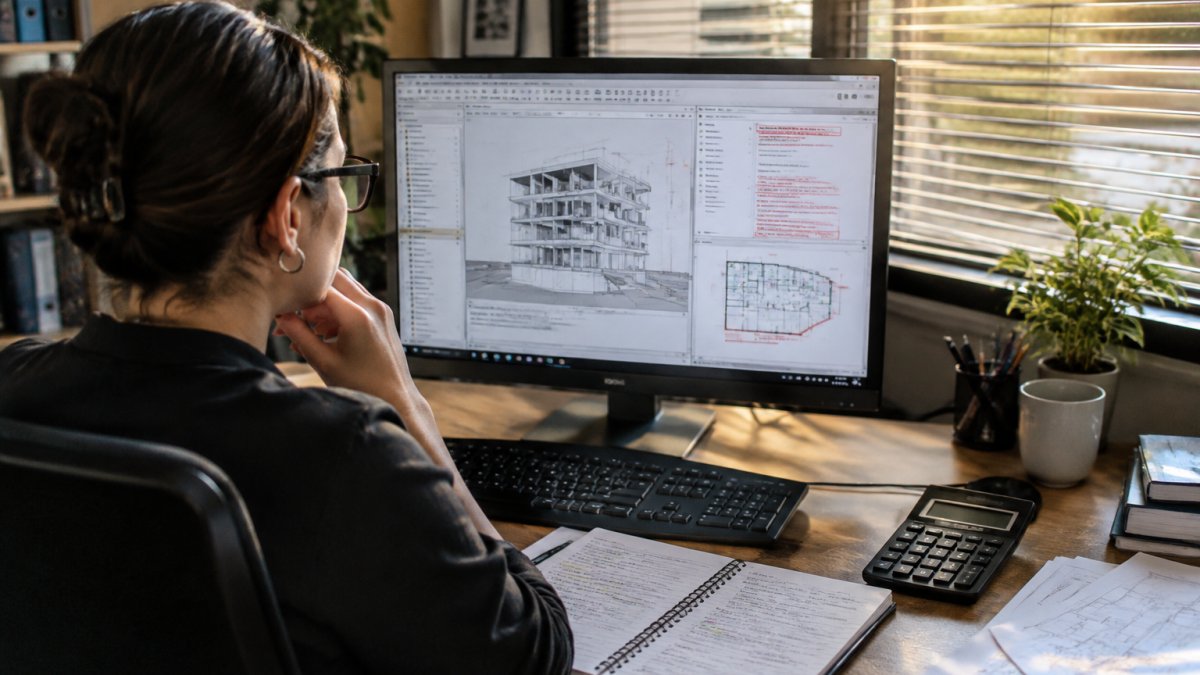
Reward speed alone and drafters skip model checks to hit sheet counts; the rework lands two weeks later on someone else's budget.
Weighing offshore drafters? Our guide on hiring offshore Revit drafters covers vetting steps to consider.
Revit Productivity Tools and Remote Drafter Performance Metrics
Tools help but do not replace a measurement method. Pull sheet counts and warning logs from Revit schedules and add-ins, then pair that data with a simple weekly review.
Use a shared tracking sheet with one row per drafter and one column per metric. Review weekly rather than daily, since frequent tracking can encourage people to focus on the numbers.
Our guide on delegating CAD redlines to remote staff gives the handoff checklist and QA criteria; for the wider plan, see how to integrate remote drafters into your design team.
Comparing Standard and High-Efficiency Drafting Metrics
Benchmarks depend on task type, so treat any single number with suspicion. Use ranges, and compare drafters against their own past output.
| Metric | Standard Range | High-Efficiency Range | What It Signals |
|---|---|---|---|
| Sheets per week | Baseline | Higher, same quality | Faster production |
| Rework rate | Noticeable | Low | Better accuracy |
| First-pass approval | Partial | Most sheets | Fewer review cycles |
For current pricing, visit the Drafting Helpers pricing page. Our breakdown of how long offshore drafting onboarding takes explains the typical ramp to productivity.
Measuring Revit drafting productivity is not about watching people work. It is about counting what ships, what comes back, and what it costs to fix. Drafting Helpers gives architecture firms vetted remote drafters at up to 70% less than domestic hiring, with a fully managed service covering payroll, benefits, and oversight. There are no long-term contracts, and replacements cost nothing. Get started with Drafting Helpers and turn your backlog into delivered drawings.
Frequently Asked Questions
What metrics measure Revit drafting productivity?
Track a small set that ties directly to output: sheets or drawings completed per week, modeled elements per hour, time per task type, and rework rate measured as the share of sheets revised after QA. Pair those with CAD deliverable quality metrics such as clash counts and annotation accuracy. Volume alone misleads, so weigh speed against rework. A drafter producing 20 sheets with a 30% rework rate is slower in practice than one producing 14 sheets with a 5% rework rate.
How do you measure productivity in a Revit project fairly?
Normalize before you compare. Group tasks by type (modeling, detailing, drafting views, single-line diagrams) and by experience level, then measure time per task rather than total hours per project. Record the baseline during project setup so scope differences are visible. Use Revit productivity tools and journal or worksharing data to log actual task time instead of relying on timesheets. Compare a drafter only against peers doing the same task type, and review trends over several projects rather than a single week.
How can architecture firms measure drafting quality as well as speed?
Set explicit CAD deliverable quality metrics and check them at each milestone: clash detection counts, alignment accuracy against coordinate systems, layer naming and file organization consistency, and the number of comments returned per sheet. Log every correction in a rework tracker so quality has a number attached. Review quality scores alongside throughput in the same report, because a team that hits deadlines by skipping QA shifts the cost into construction. Remote Revit drafter performance metrics should include both.
